How can we help you?
Statistics
You will find in this article :
Would you like to have statistics for your teams or files? Beenote makes it easy for you!
If you are an account manager or an administrator, you have an extra section in your left menu. It is the Statistics section.
To view the statistics
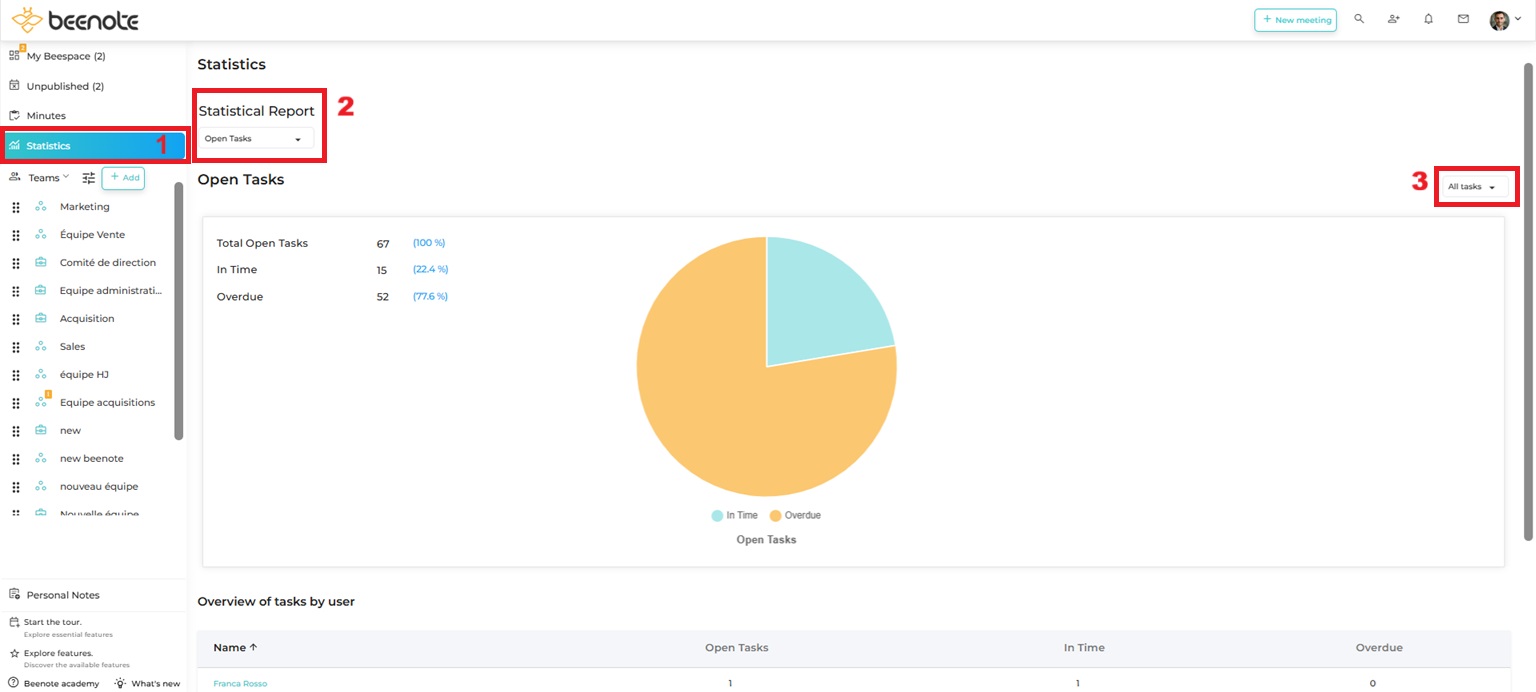
(1) Go to your left menu. Click on Statistics.
This is where you will have access to the statistical reports related to your work teams or files.
It is possible to choose which statistics you want to see.
(2) Choose by clicking on the arrow to access the drop-down menu between:
• Open tasks
• Tasks
• Meetings
• Meetings Attendance
(3) You can also choose in the left drop-down menu your statistics between all the tasks, the work teams or the desired folders.
Statistical Reports
Statistics: Open Tasks
The statistics are presented in two different visuals to ease the understanding of the data.
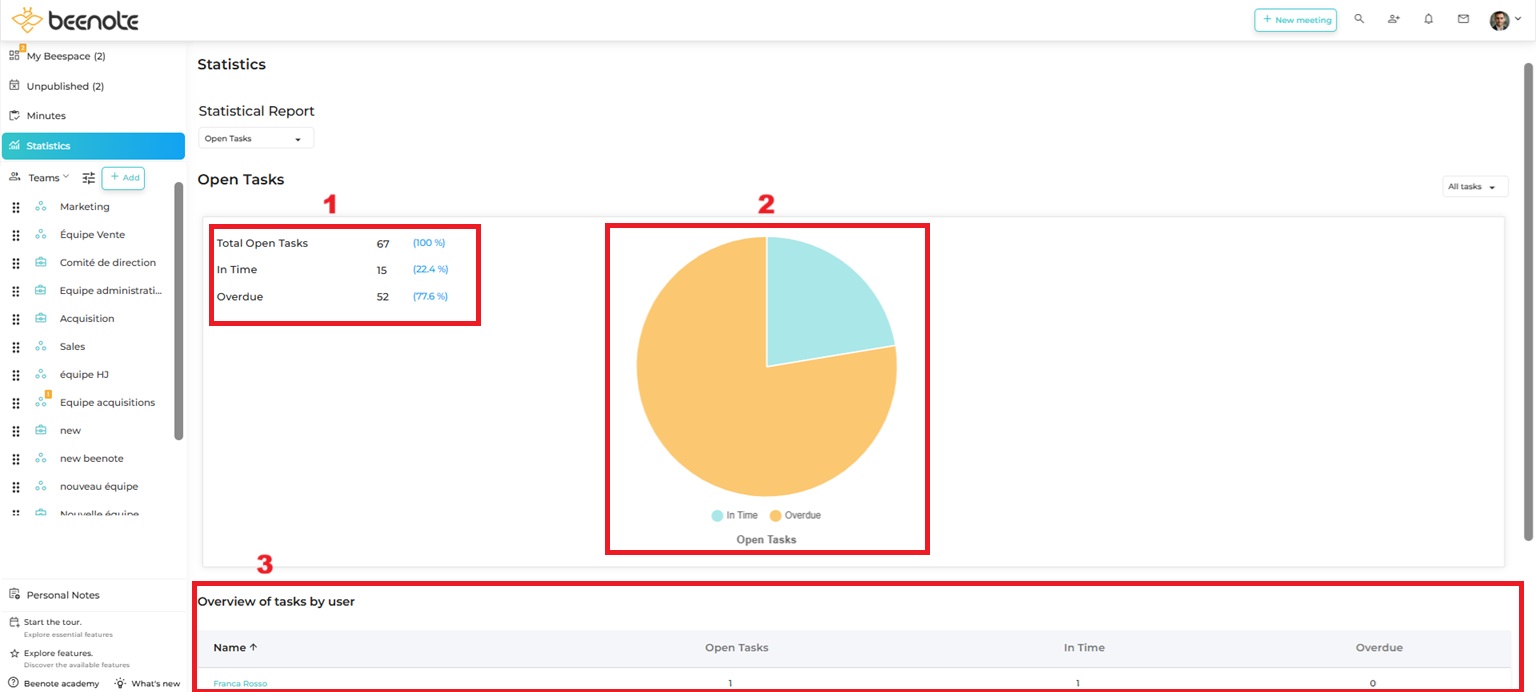
(1) To your right, you have a list with Total Open Tasks, In Time and Overdue, each with a corresponding number and percentage in parentheses.
(2) To your left, you have a circle graph representing the data.
The open Tasks correspond to all active tasks. of all members of the organization including suspended accounts (e.g. member on sick leave).
This means that these are the Not Started, In Progress, Pending and Overdue tasks.
So it excludes Completed and Cancelled tasks as well as accounts that have been closed.
(3) In the lower part of the page, you have a table showing the statistics of open tasks, by user, under Tasks Overview by User.
This will show you how many tasks each person has open, how many are on time and how many are overdue.
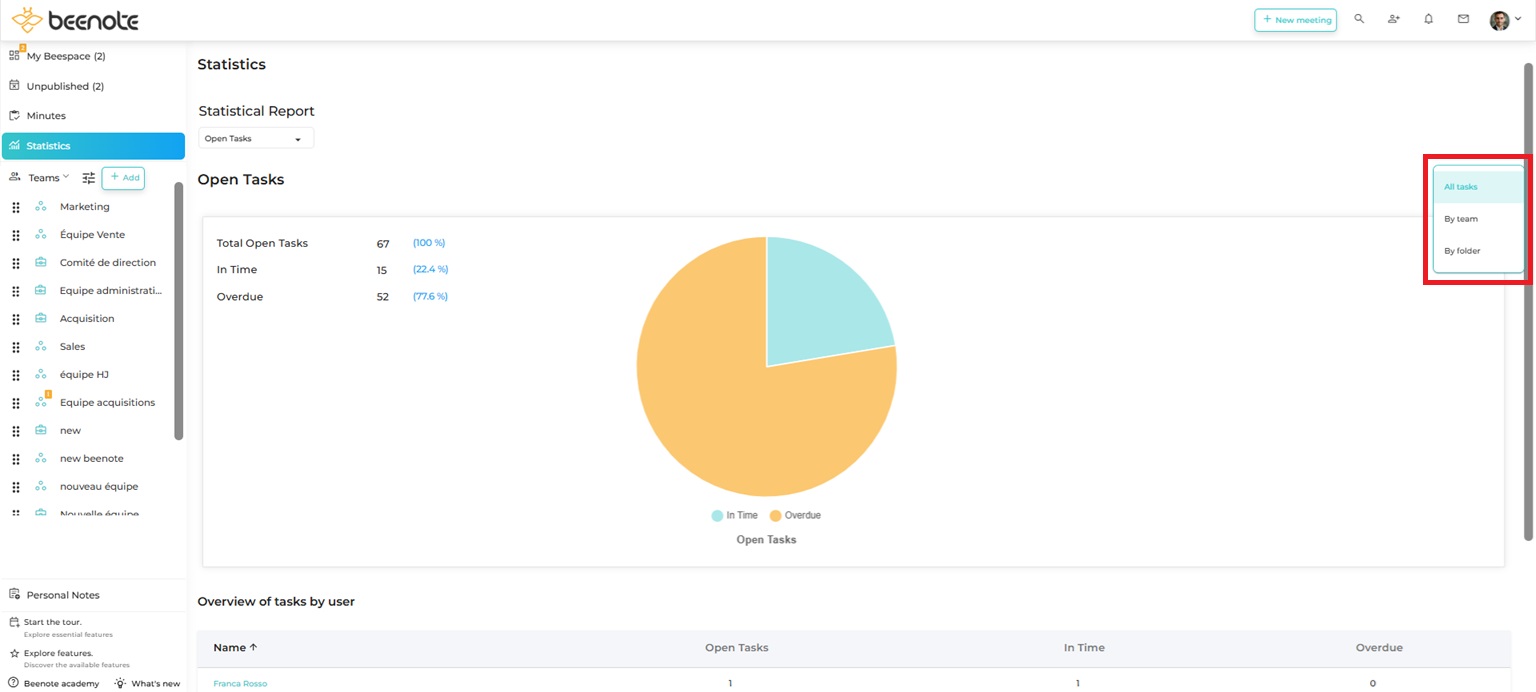
You can narrow your search by searching by folder or by team.
Depending on what you choose, a new drop-down menu will appear to allow you to select the team or folder you wish to view.
Statistics: Tasks
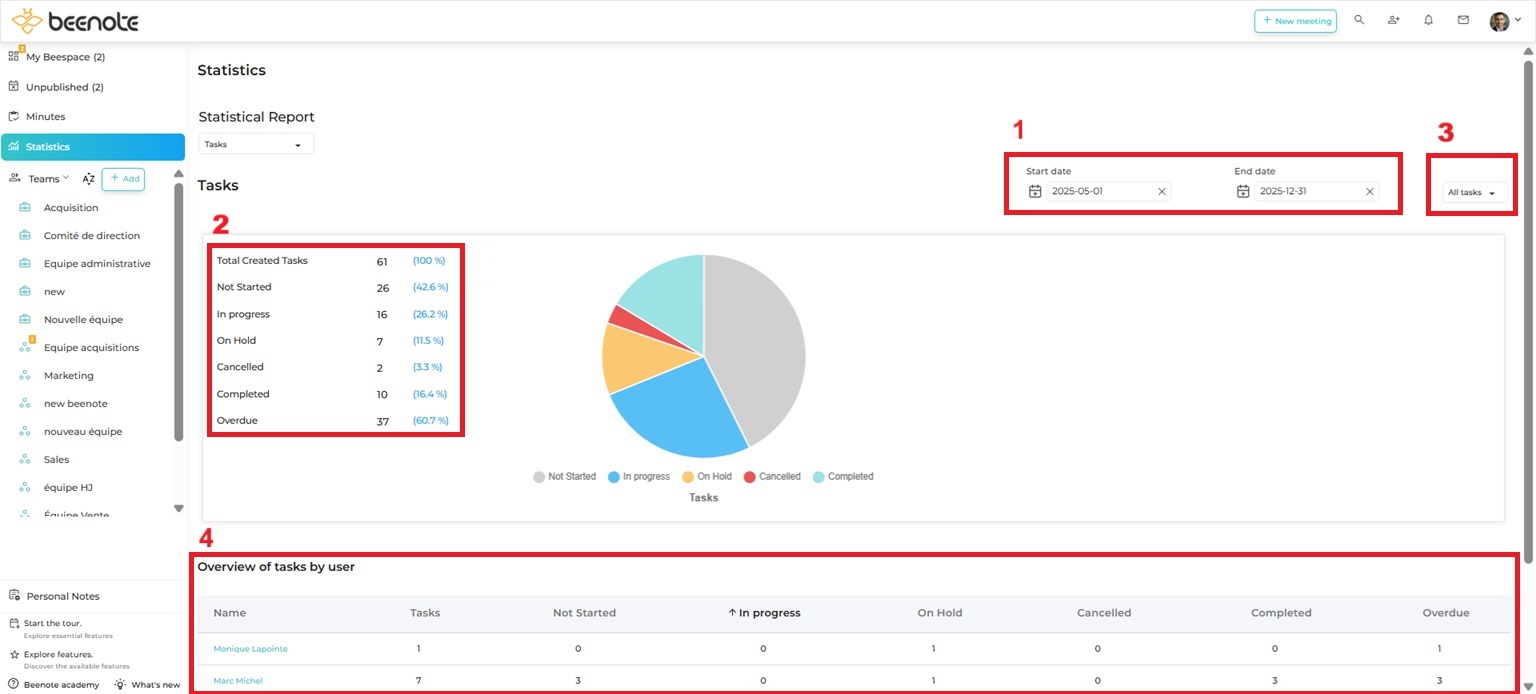
In Tasks tab, you will have access to more detailed statistics on the created tasks. That is, you will be able to select them according to:
- A specific period of time (1)
- Their status: Not started, In progress, Pending, Cancelled, Completed and Overdue (2)
- All tasks, by team or file (3)
- The tasks by user. You can see the number of tasks and how many tasks the user has by status (4)
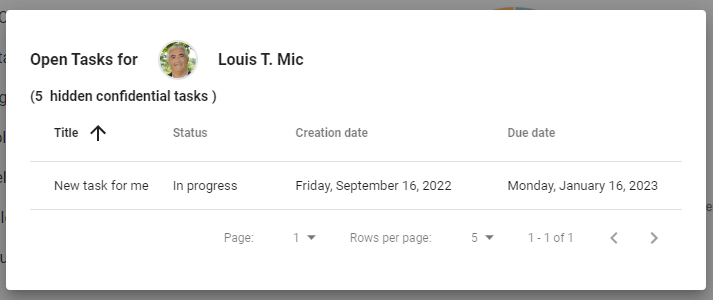
To get more details about the open tasks of your team members, you have to click on the person’s name and a window will display the information.
Statistics: Meetings
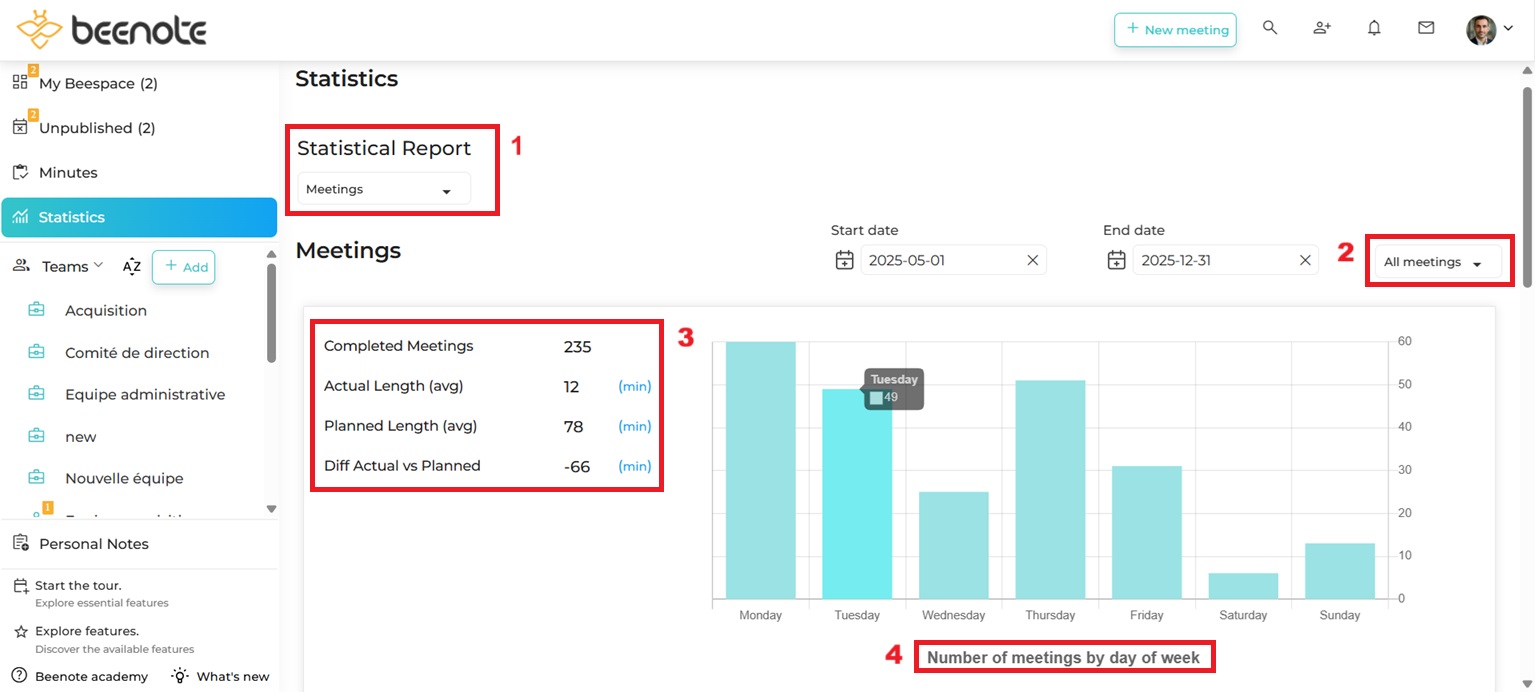
In this section, you have access to statistics for your team meetings (1), according to your folders or for all your meetings (2).
You can select the time period you wish to target to extract the data.
The statistics presented in this section are the number of completed meetings, the average actual and planned length of your meetings and the difference between the two, all presented in numbers and figures (3).
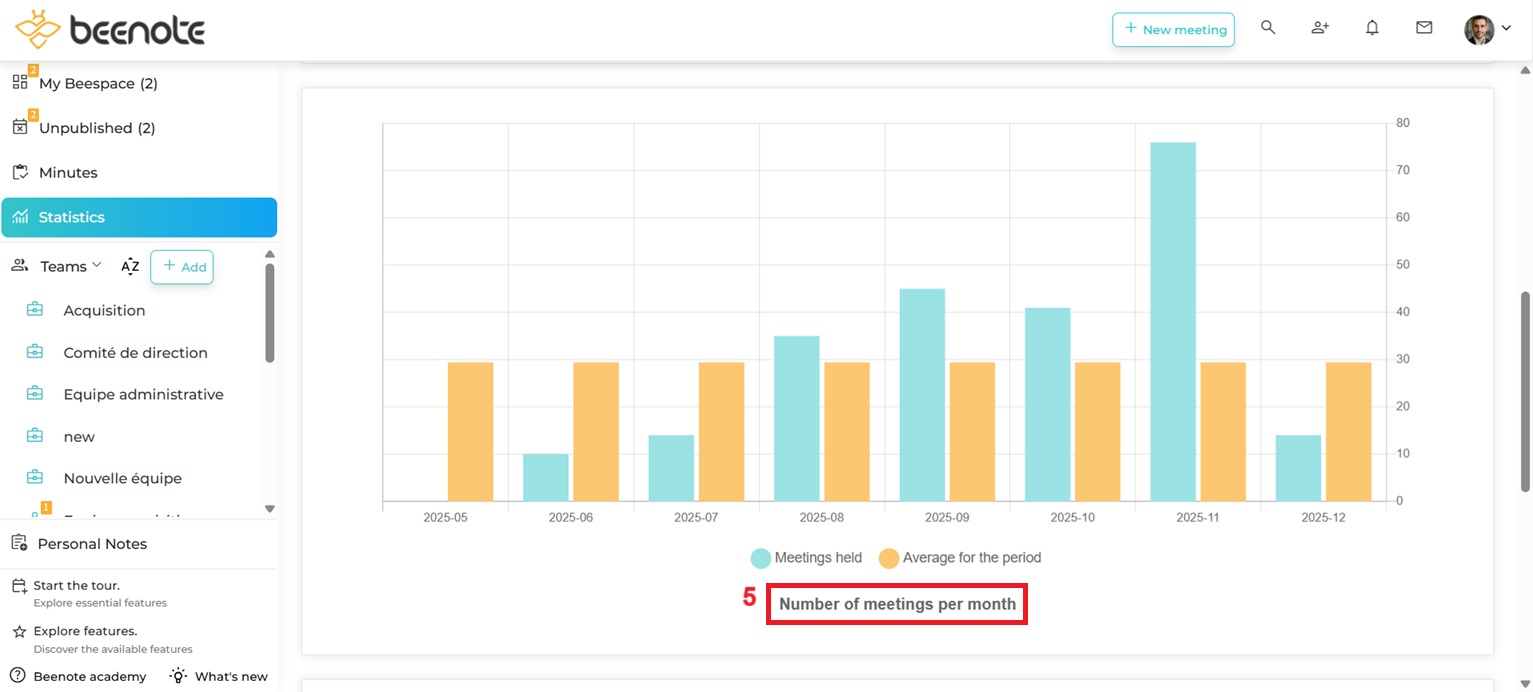
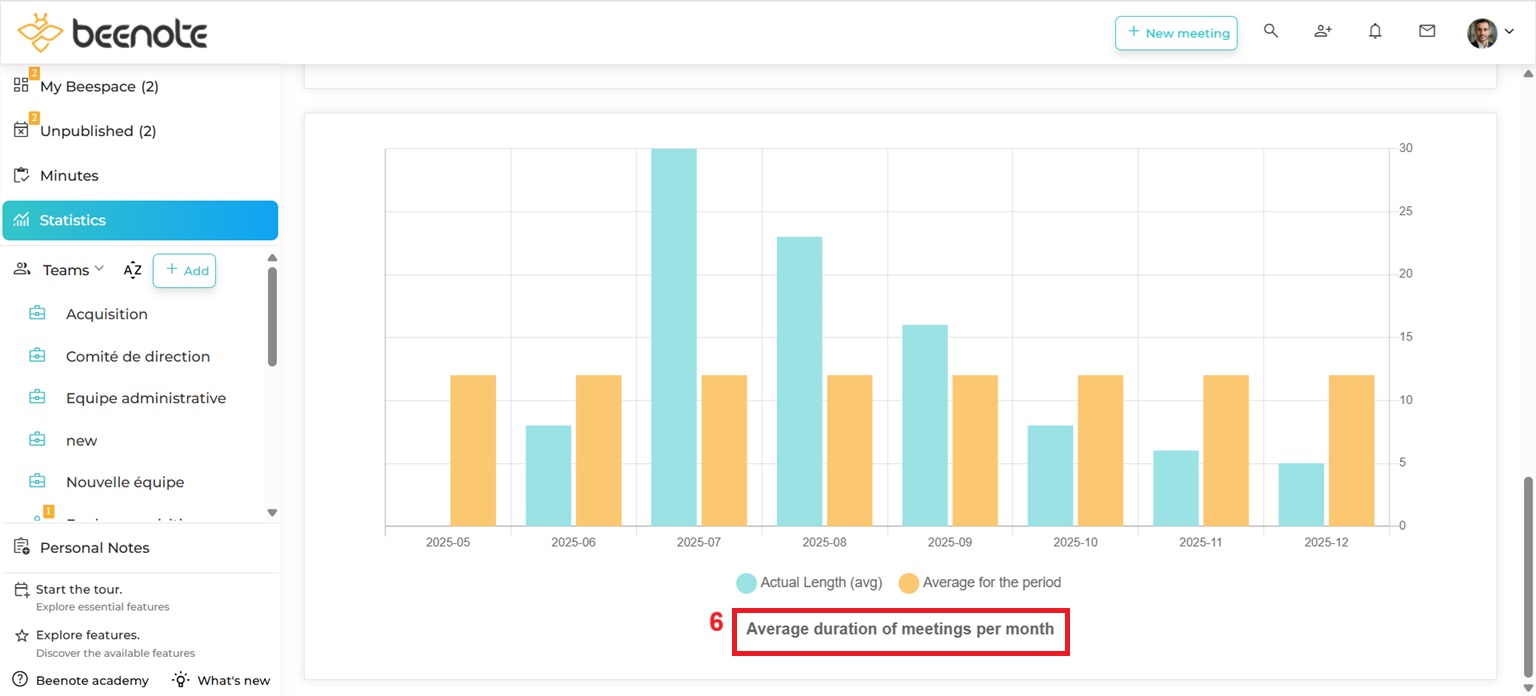
The statistics are also presented in graphical form with the following information:
- The number of meetings by day of the week (4) (👆)
- The number of meetings per month (5) (👇)
- The average duration of meetings per month (6) (👇)
Statistics: Meetings Attendance
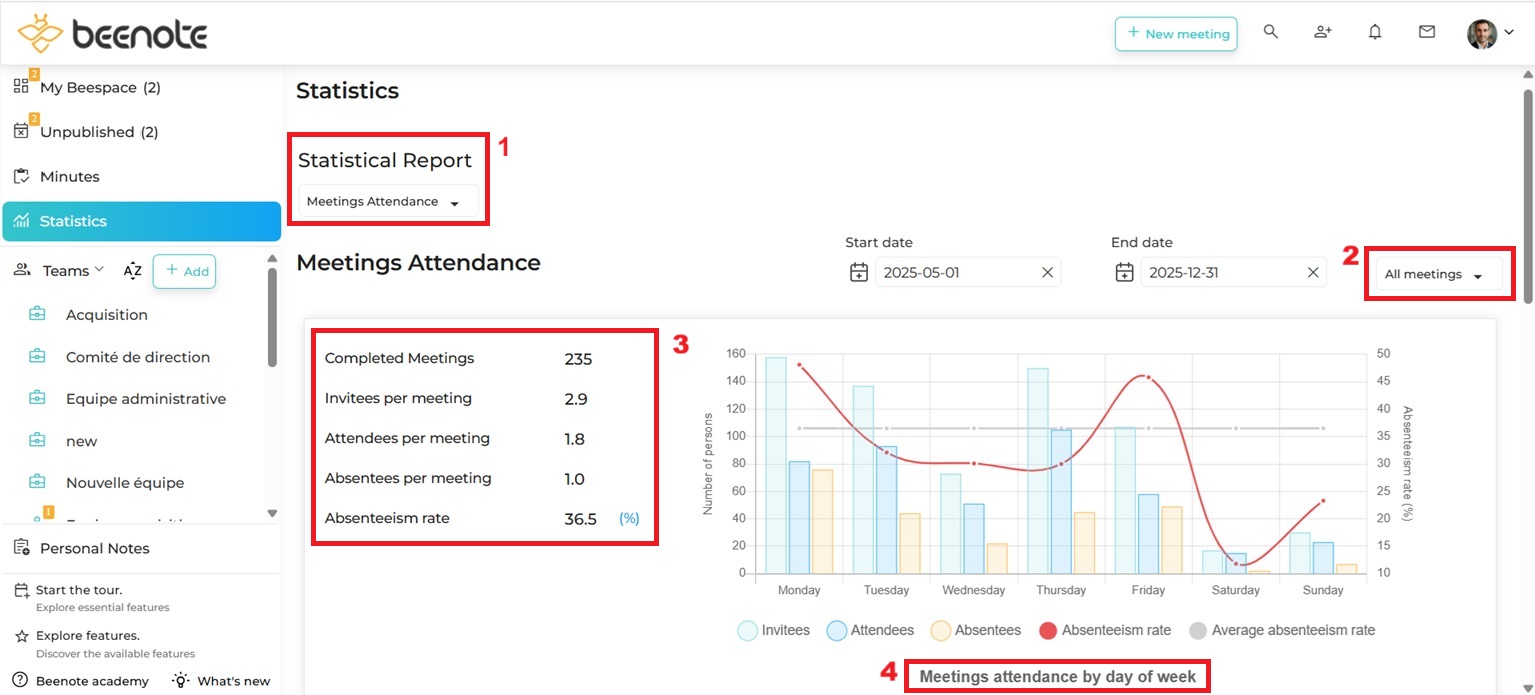
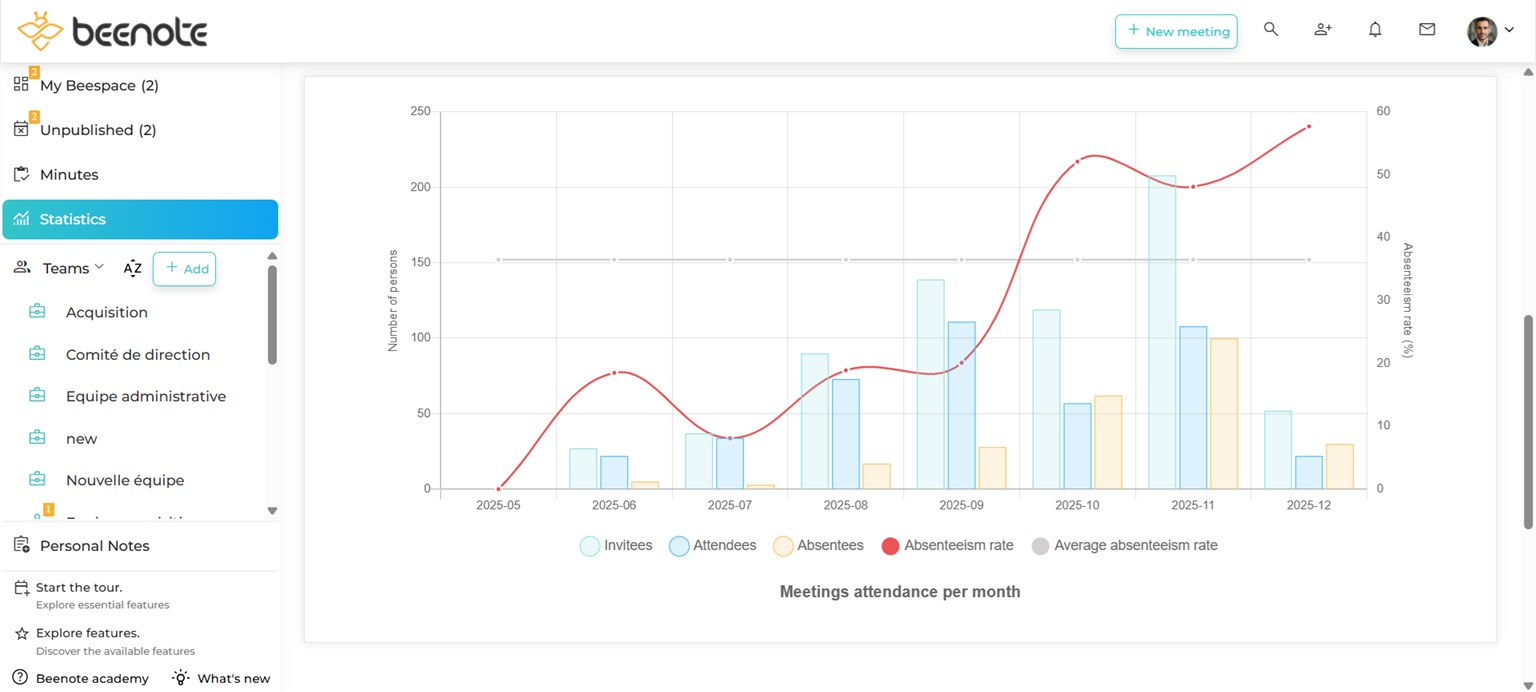
As for the other sections, you have access to the meeting attendance statistics for your teams (1), according to your files or for all your meetings (2).
Now, select the period you want to target to extract the data.
The statistics are all presented in numbers and percentages in this section by (3):
- The number of completed meetings
- The number of guests per meeting
- Attendance and absence per meeting
- The absenteeism rate
You also have meeting attendance by:
- Day of the week (4) (👆)
- Meeting attendance by month (5) (👇)
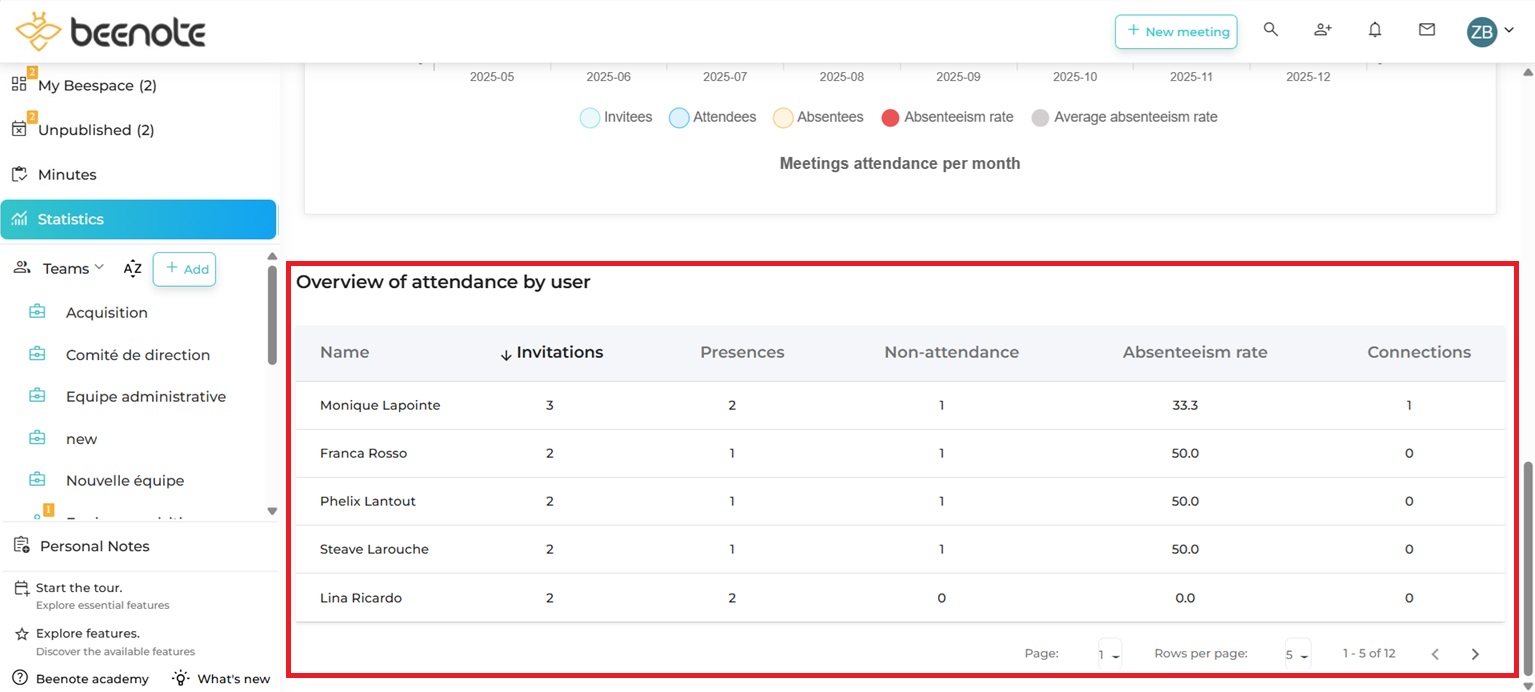
At the bottom of the page, you have a table showing the meeting attendance statistics.
You will be able to view:
- The number of invitations each user has received
- The number of meetings they attended or did not attend
- The absenteeism rate calculated for each person
Notes: The Attendance Overview by User includes all people who have been invited to Beenote including external invitees, and suspended and closed accounts.
Also, you will have the number of connections to a meeting per person. That is, the number displayed in this column represents the number of times the person started a meeting or joined a meeting in progress.
Article that may interest you: What is the best way to organize tasks from Beenote?
![]() Next steps
Next steps
Create an account: View the detailed steps to create an account
Account settings: Start by setting up your Beenote account
Create an agenda: Master the writing process to be well prepared before the meeting
Assign tasks in meeting: Assign personal tasks to your team members during the meeting

